Binance Chart Settings: From Buy/Sell Markers to Drawing Support Lines
Learn how to plot your own entries and exits directly on the Binance chart, set up the essentials, and draw clean support lines — a complete walkthrough even a beginner can follow.

You're staring at the chart and can't remember where you got filled, so you open up your trade history to check. Some people go as far as writing the entry price down and flipping back and forth. You don't need any of that. Binance can plot your fills right on the candles. The setting is just off by default, so most people never find it.
This guide covers how to turn those buy/sell markers on, plus the basic chart setup — drawing support lines, changing timeframes, and everything else you need.
💡 Before you start
- New to Binance futures? 👉 [Futures trading guide]
- Signup bonus + fee discount 👉 [Check the Binance signup bonus]
1. Switch to the TradingView chart
1. Open the trading screen
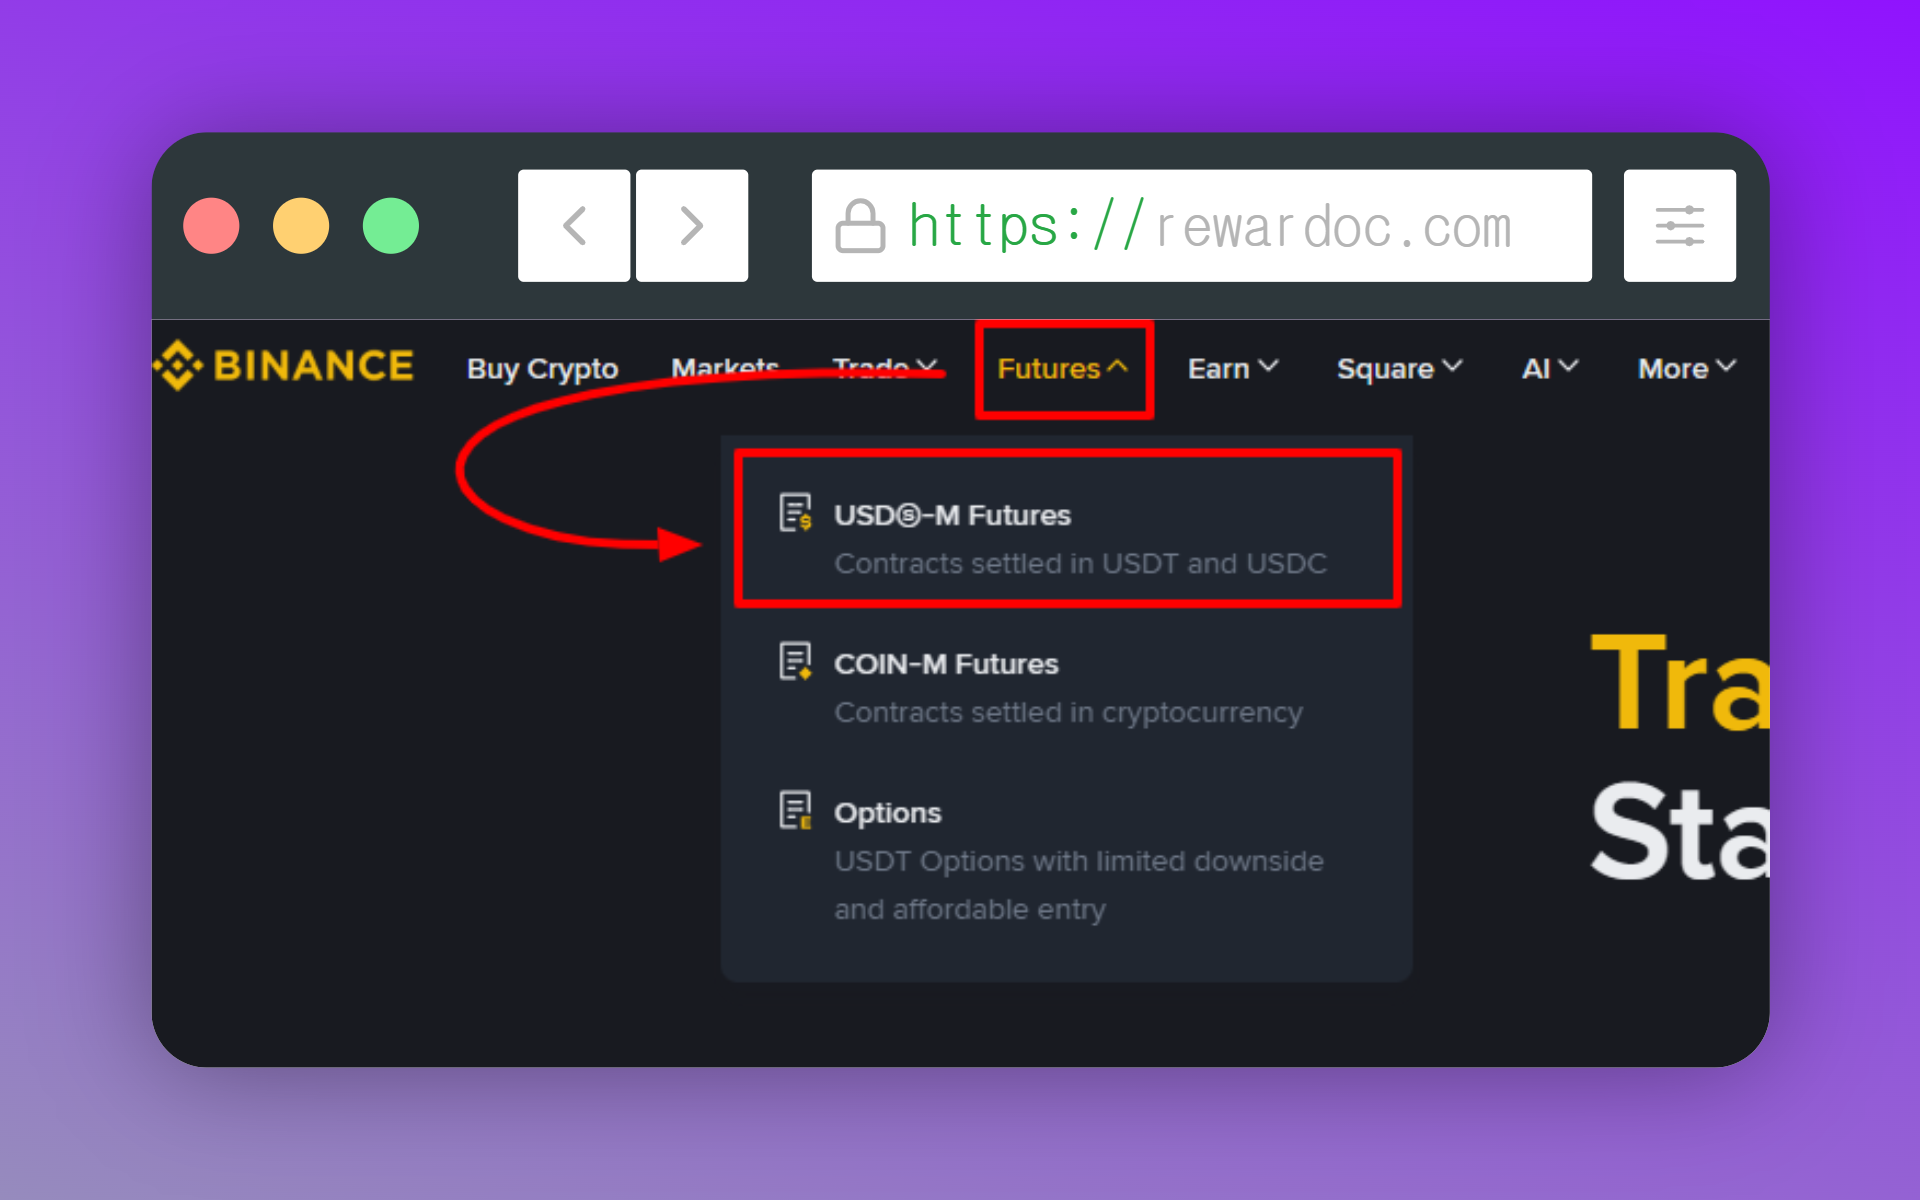
From the top menu, hit [Trade] and pick [Spot] or [Futures]. I'm on the futures screen here.
2. Change the chart mode
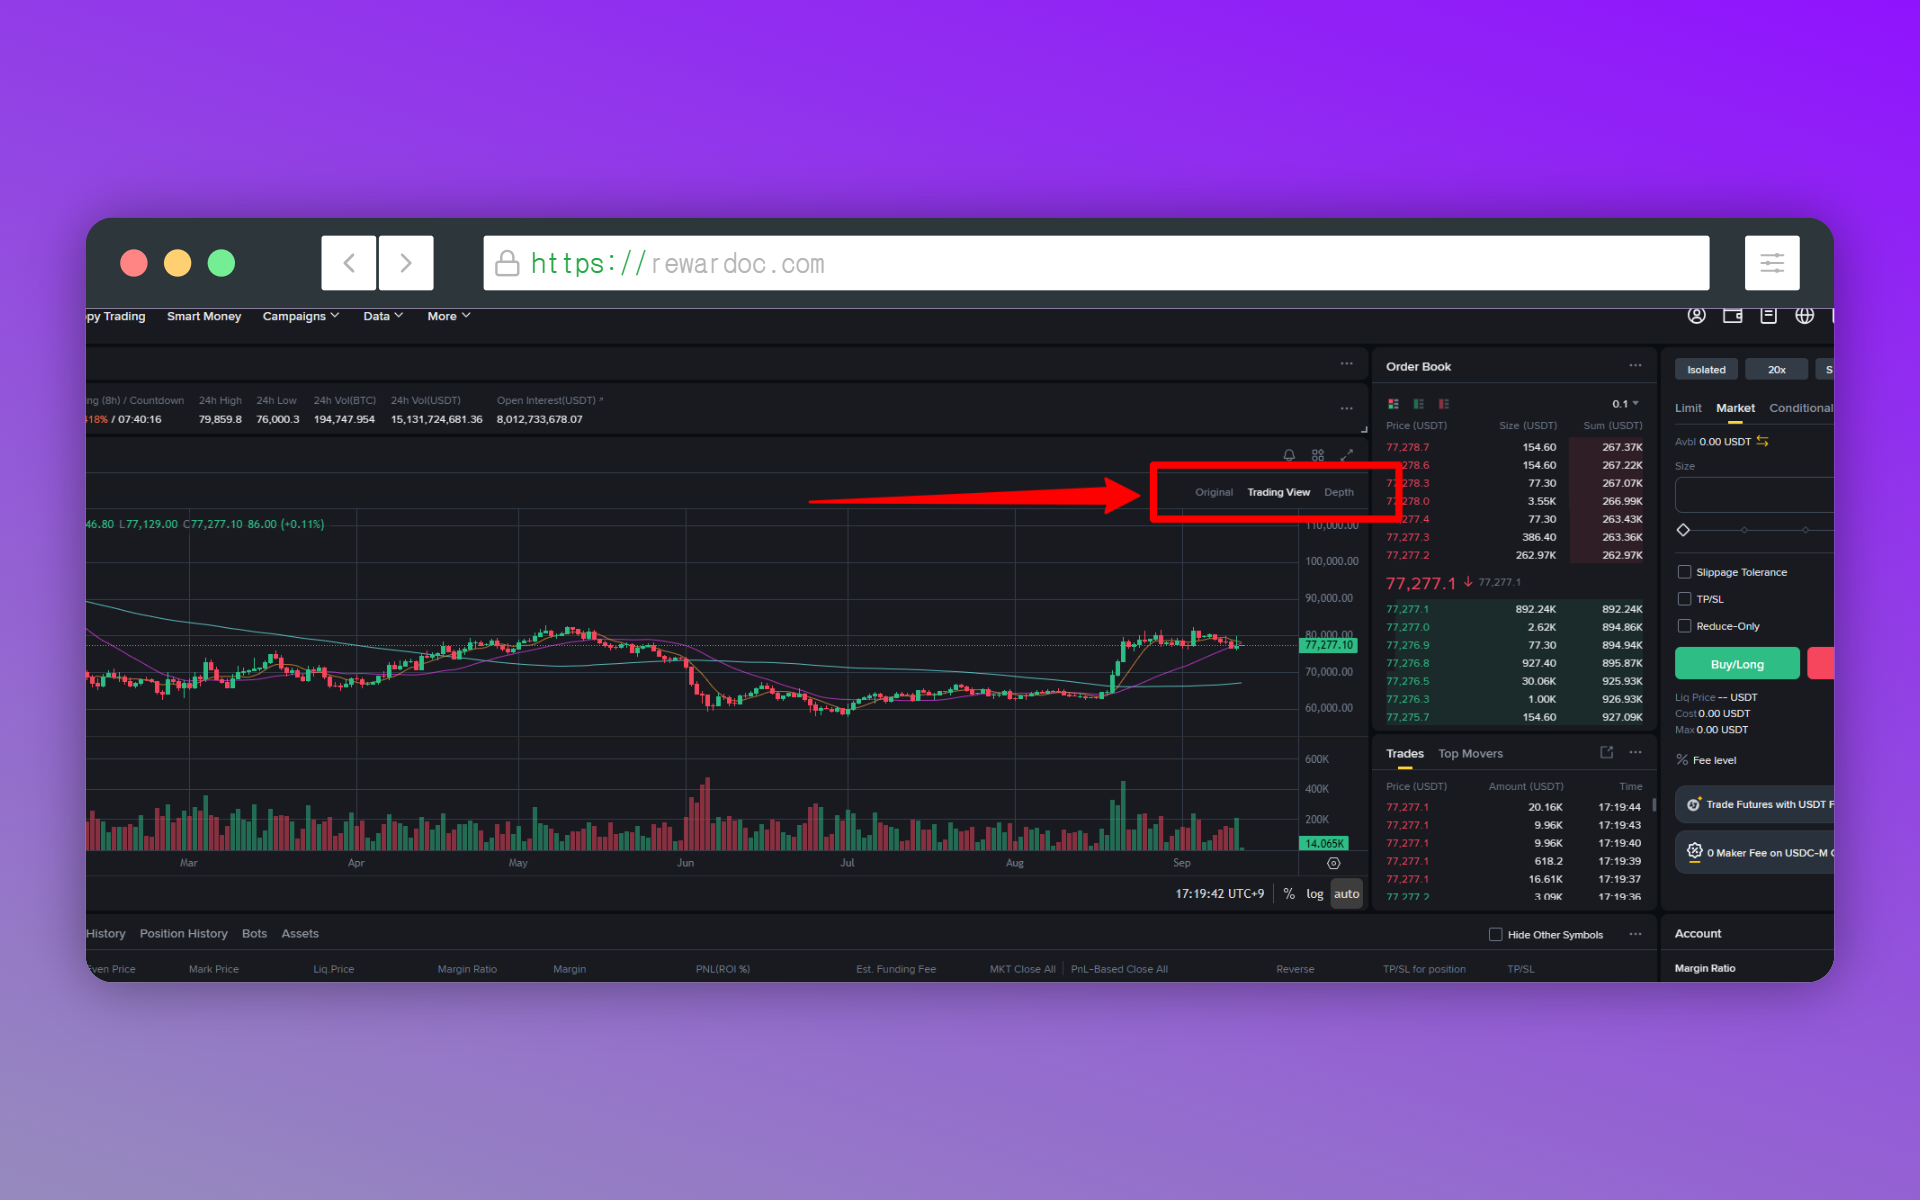
Above the chart you'll see three tabs: [Original], [Trading View], [Depth]. Pick [Trading View].
Drawing tools and indicators only work properly in [Trading View] mode. Original is stripped down — even drawing a single line is a chore. And [Depth] visualizes the resting orders sitting in the book, so it's a different tool altogether.
2. Turn on your buy/sell markers
1. Click the settings icon
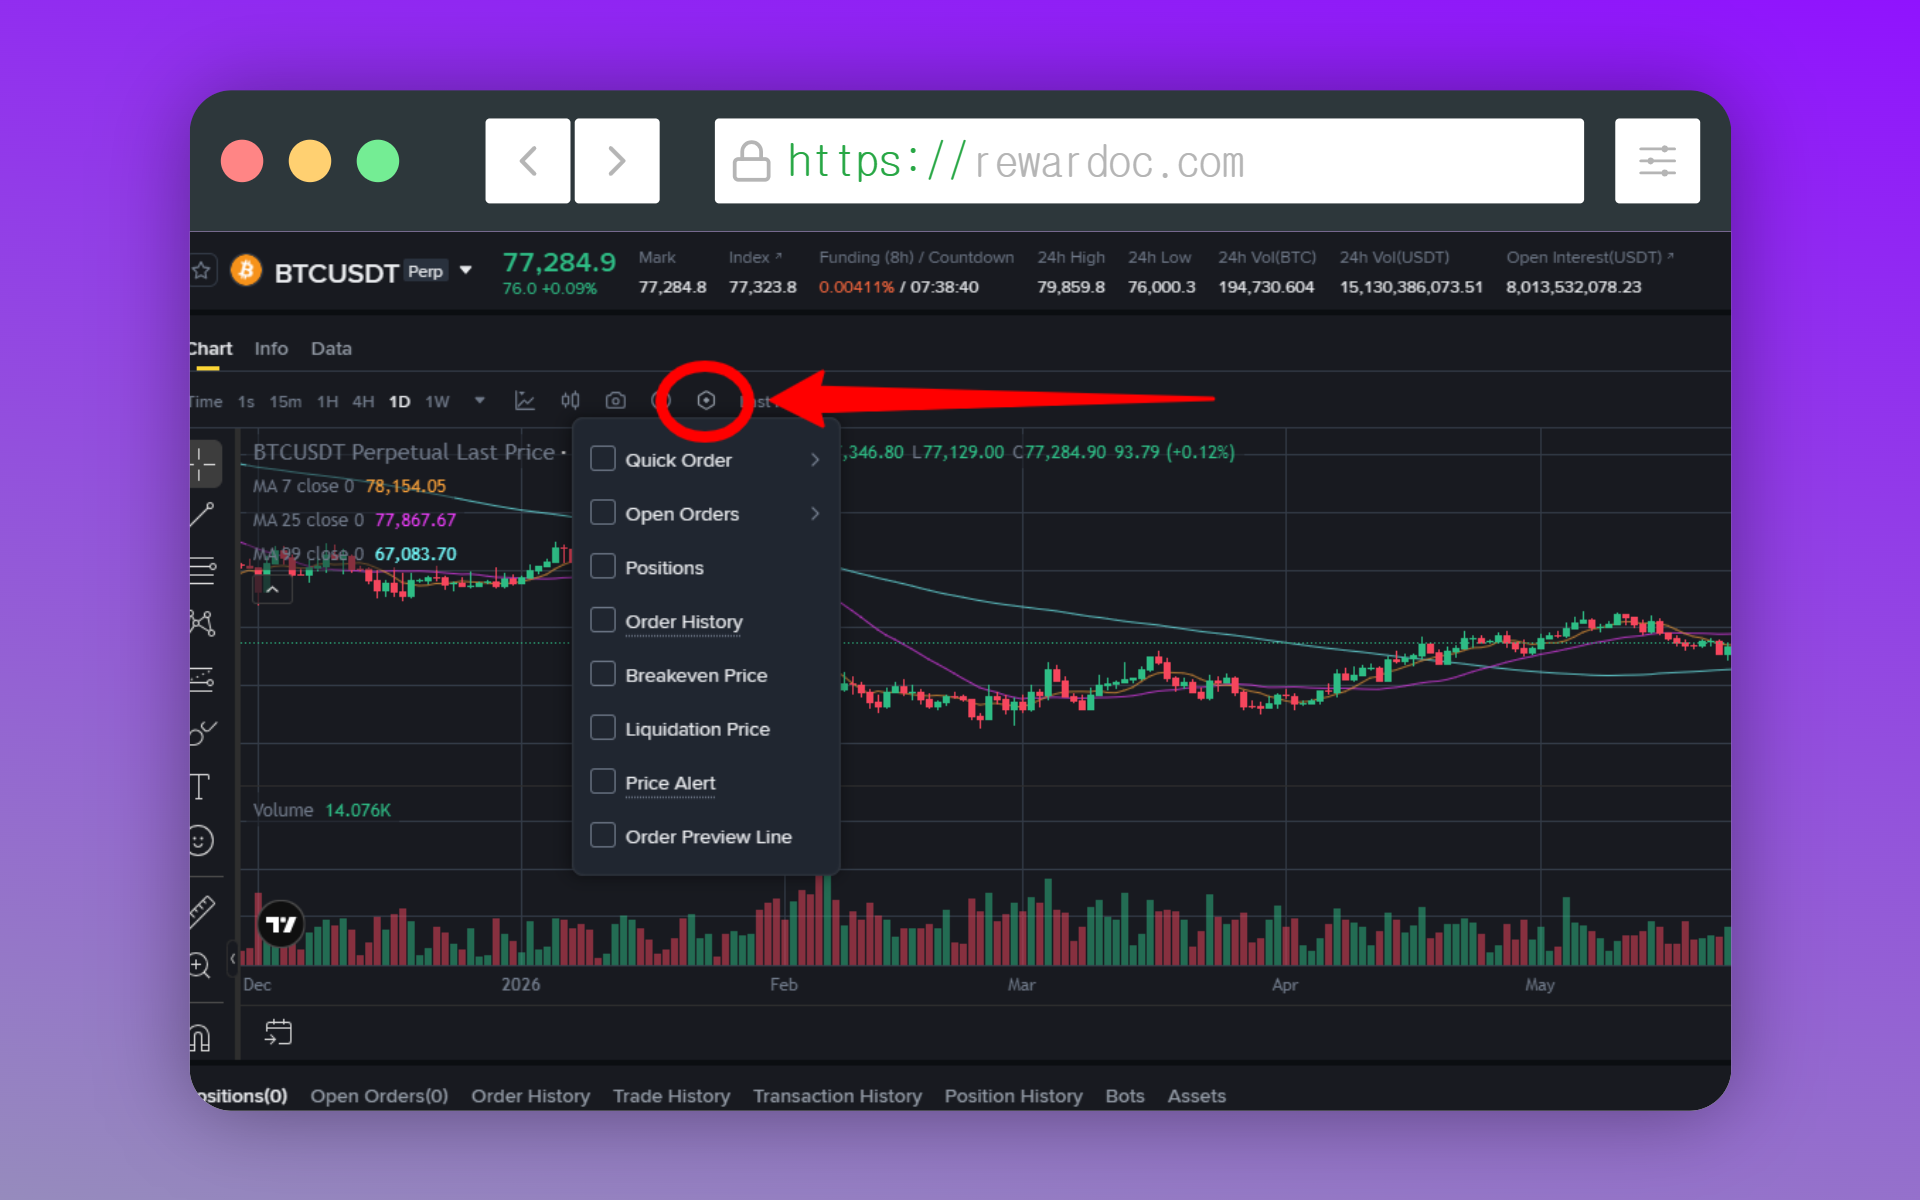
Click the [Settings] icon on the chart. Every order-display checkbox lives in here.
2. Tick the order display boxes
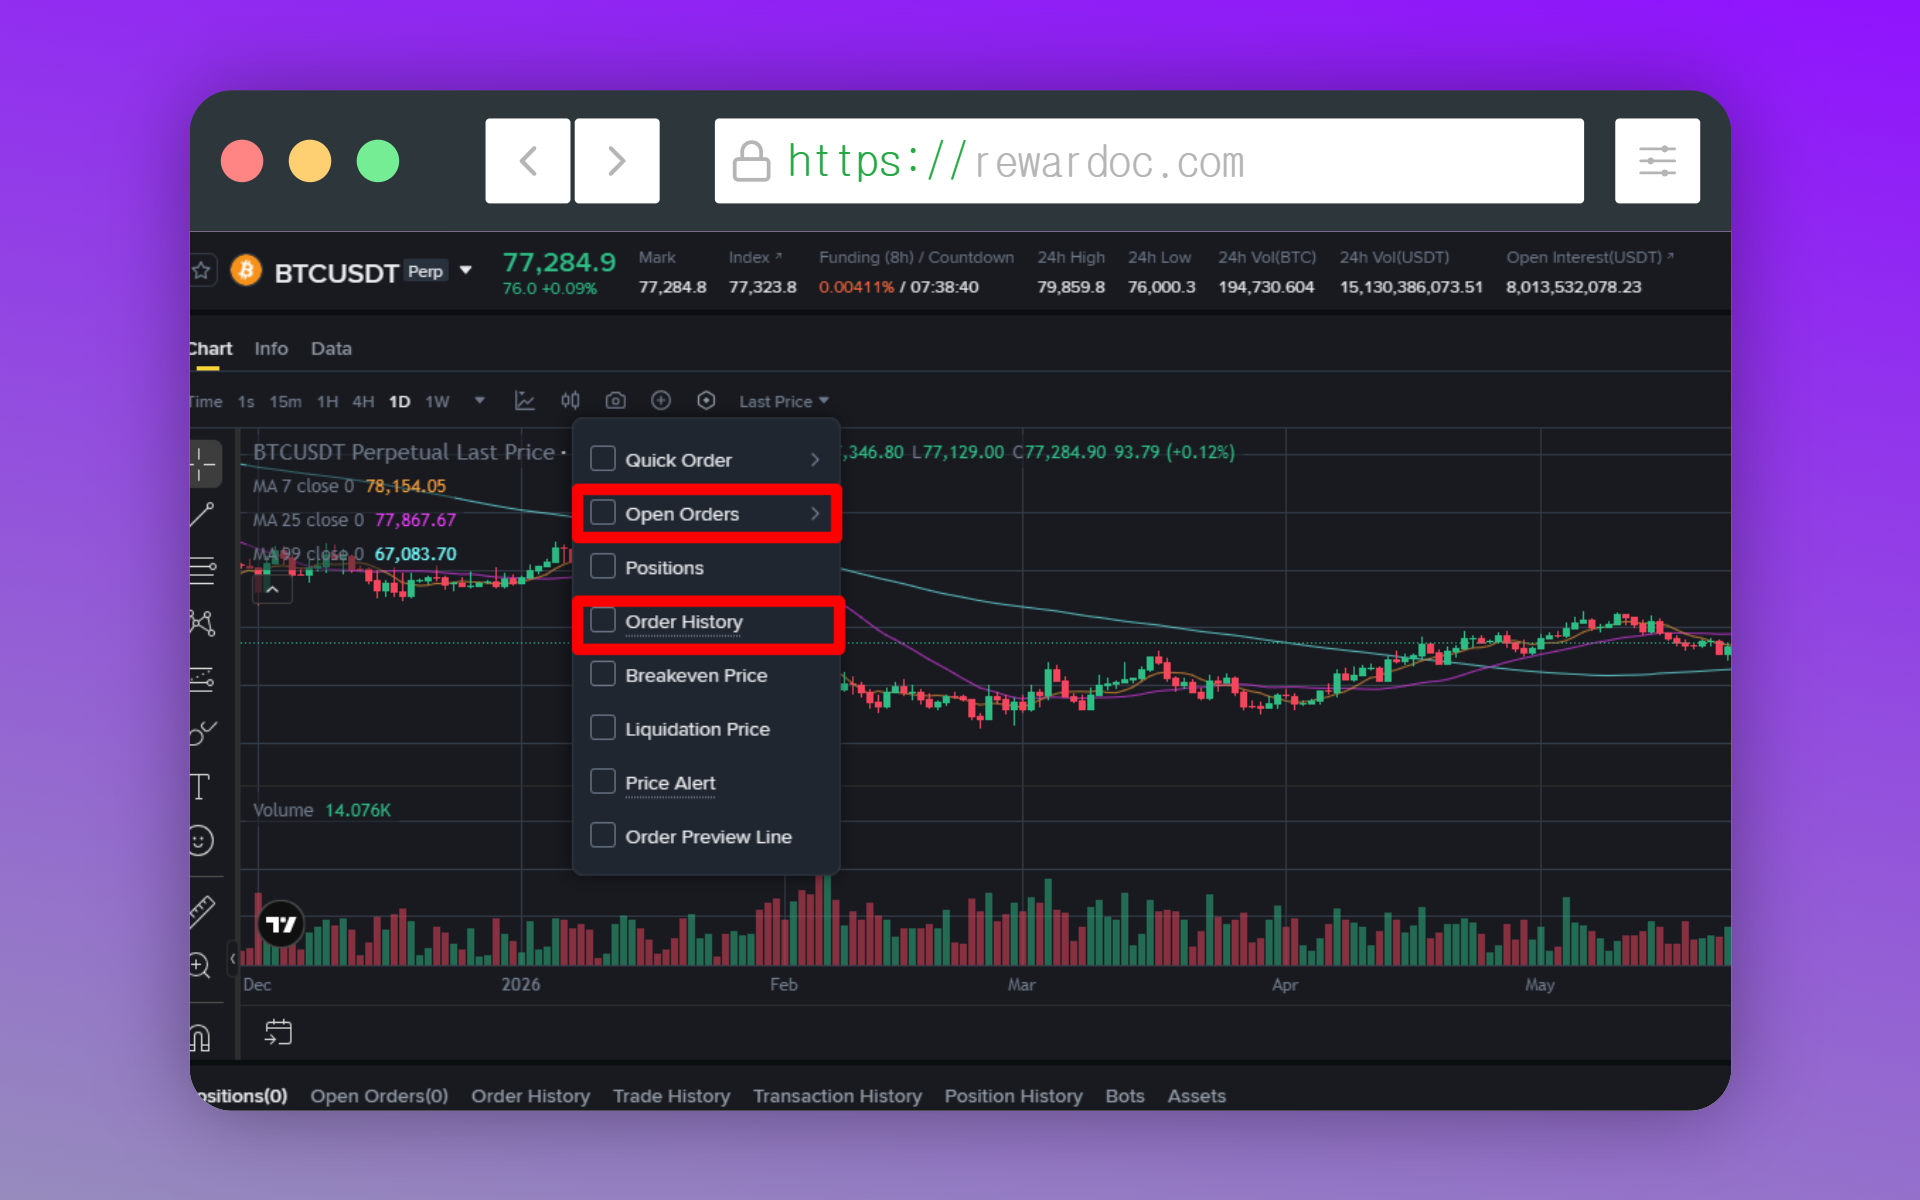
Tick Open Orders and Order History. The chart updates the moment you check them.
One thing to know. Order History only plots fills from the last 6 months, and only the 500 most recent ones. Older entries won't show up on the chart at all.
3. Read the markers
Filled orders appear on the candles as [B] for buys and [S] for sells. In TradingView mode they can also show as arrows — green for buys, red for sells. Hover over a marker and you'll get the price and size of that order.
4. Working with open orders
Limit orders that haven't filled yet sit on the chart as a horizontal line with a box attached. Drag that box to a new level and the order is repriced right there. No retyping numbers in the order panel.
You can cancel from the same line too. When you're nudging an order around while watching the book, this is much faster.
3. Drawing support lines and trendlines
1. Open the drawing tools
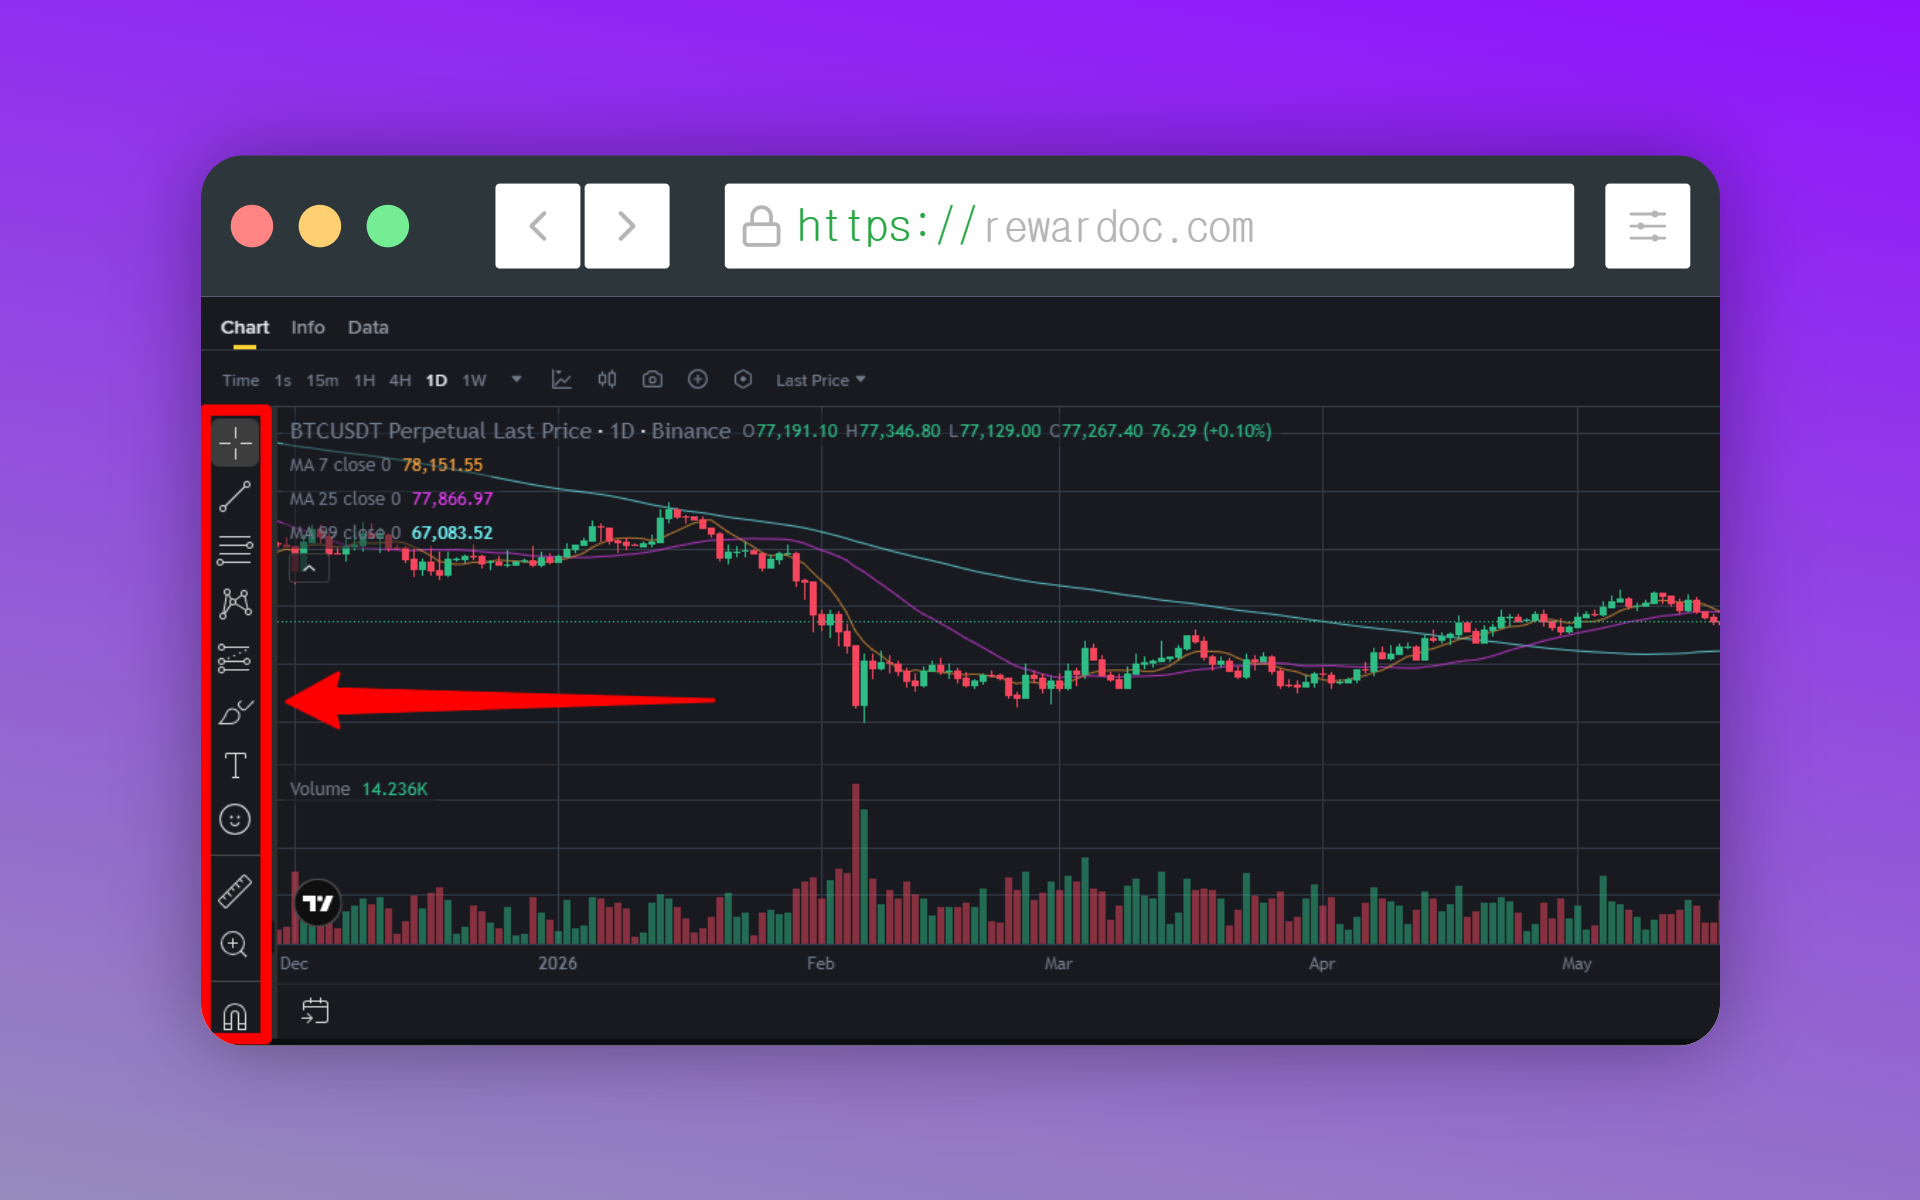
That vertical strip of icons down the left side of the chart is the drawing toolbar. It only shows up in TradingView mode.
Right-click any icon and the rest of that family folds out. The line icon alone holds horizontal lines, trendlines, vertical lines, parallel channels, and more.
2. Draw a support line
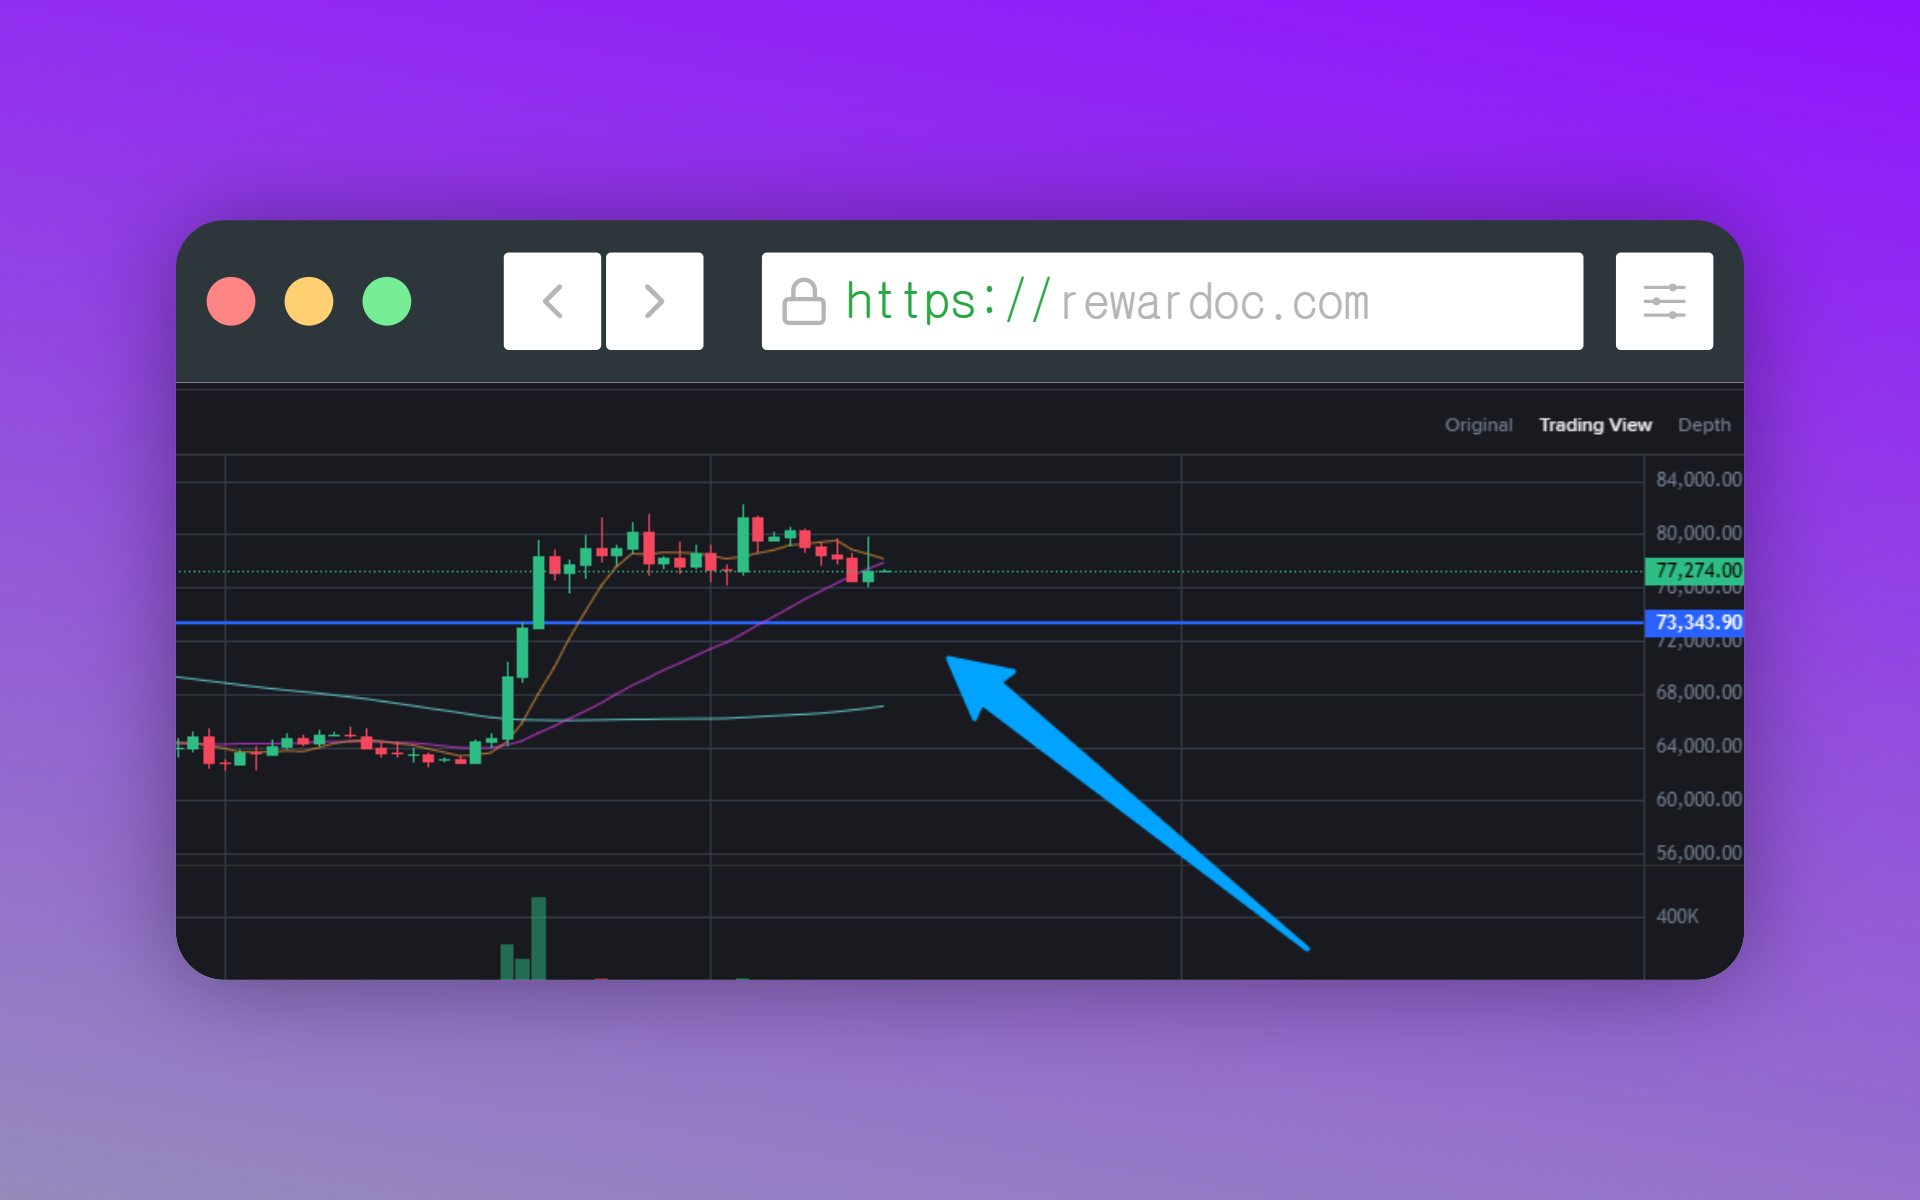
Grab the horizontal line tool and click the level you want. That's your line. Use it to mark support or resistance. Drag it to move it, or double-click to open a panel for color and thickness.
3. Draw a trendline
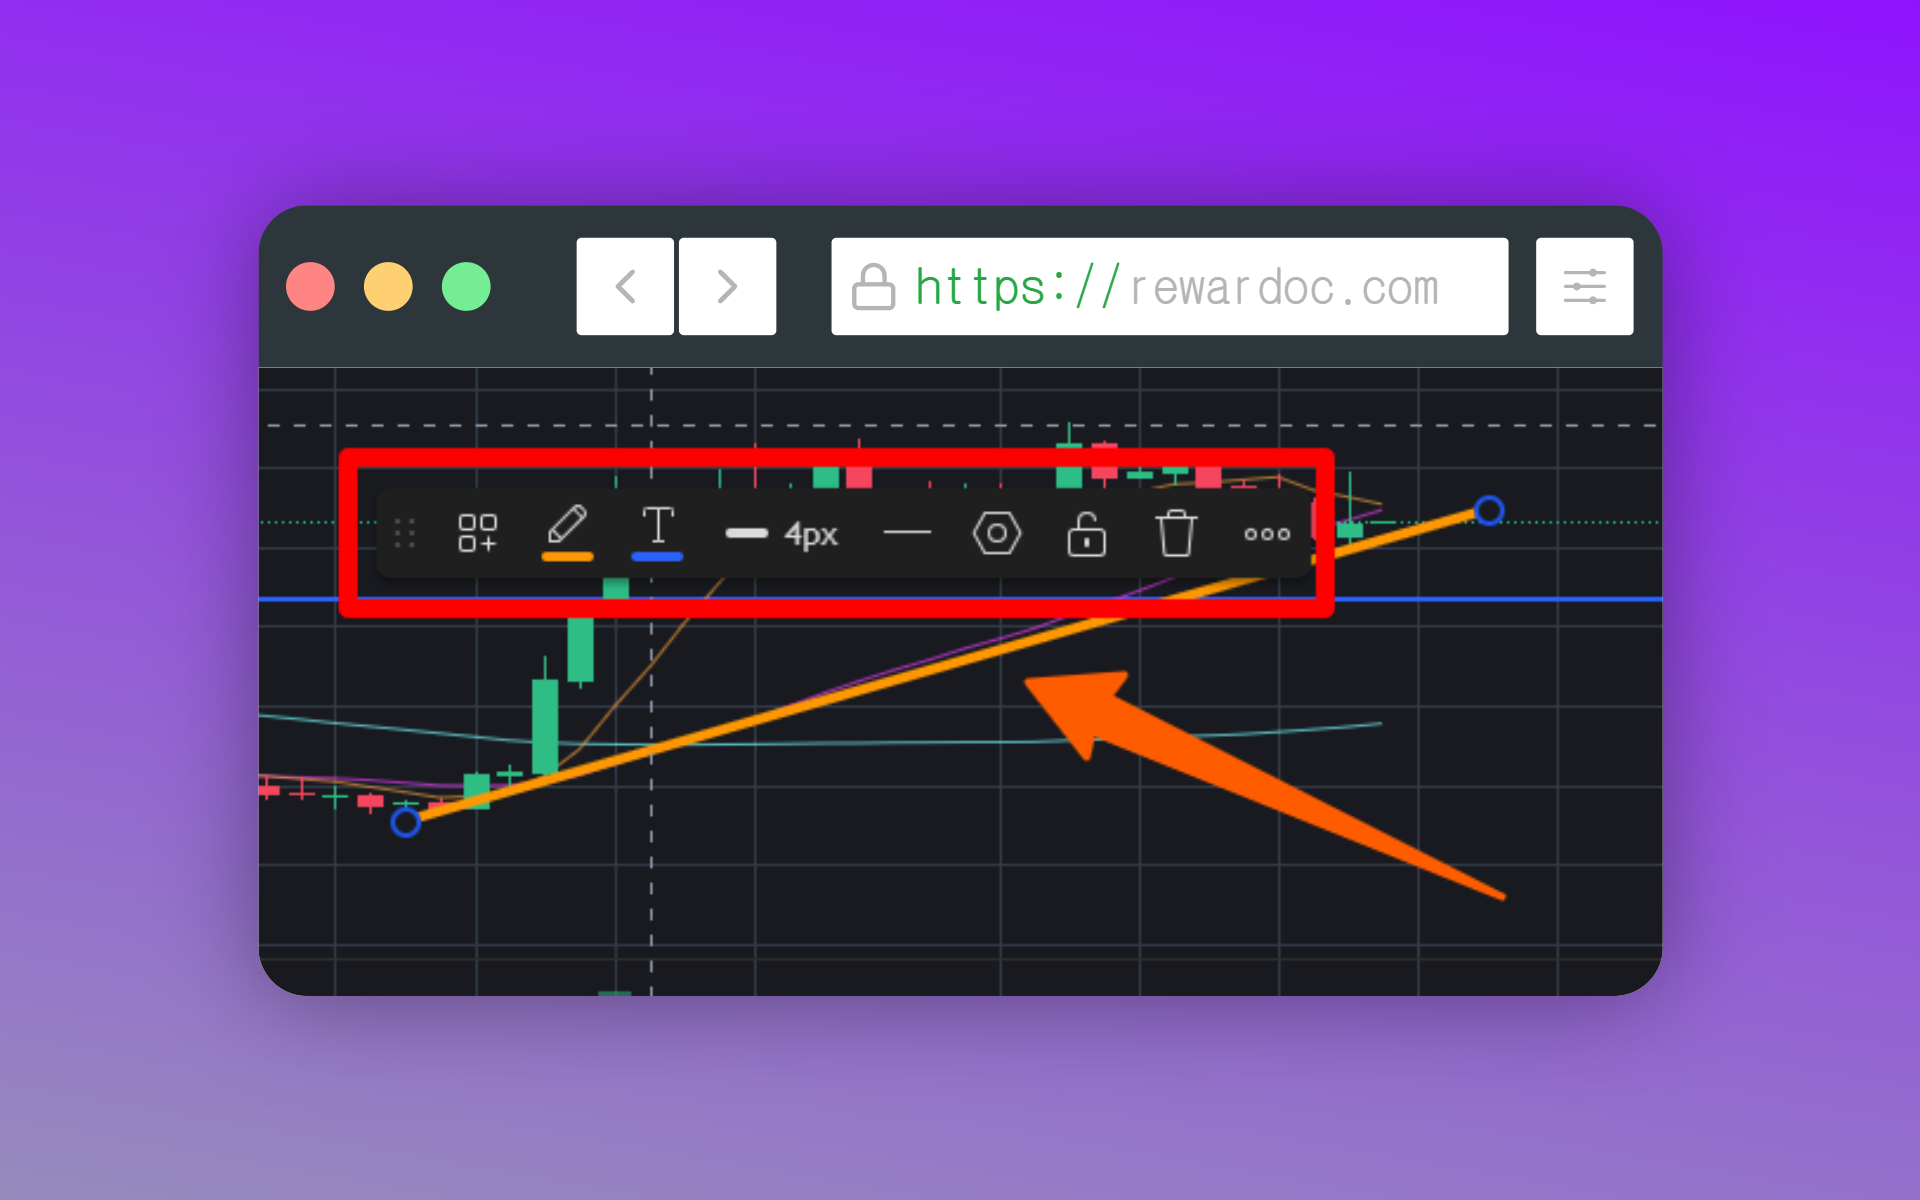
Select the trendline tool, click your starting point, then click again at the end point. Click the line itself and you can change the color and thickness so it reads clearly. Connect two lows for an uptrend line, two highs for a downtrend line.
To delete a drawing, select it and hit [Delete]. If the chart has turned into a mess of lines, right-click on it and choose [Reset Chart], or clear everything at once with [Alt + R].
4. Basic chart settings
1. Change the timeframe
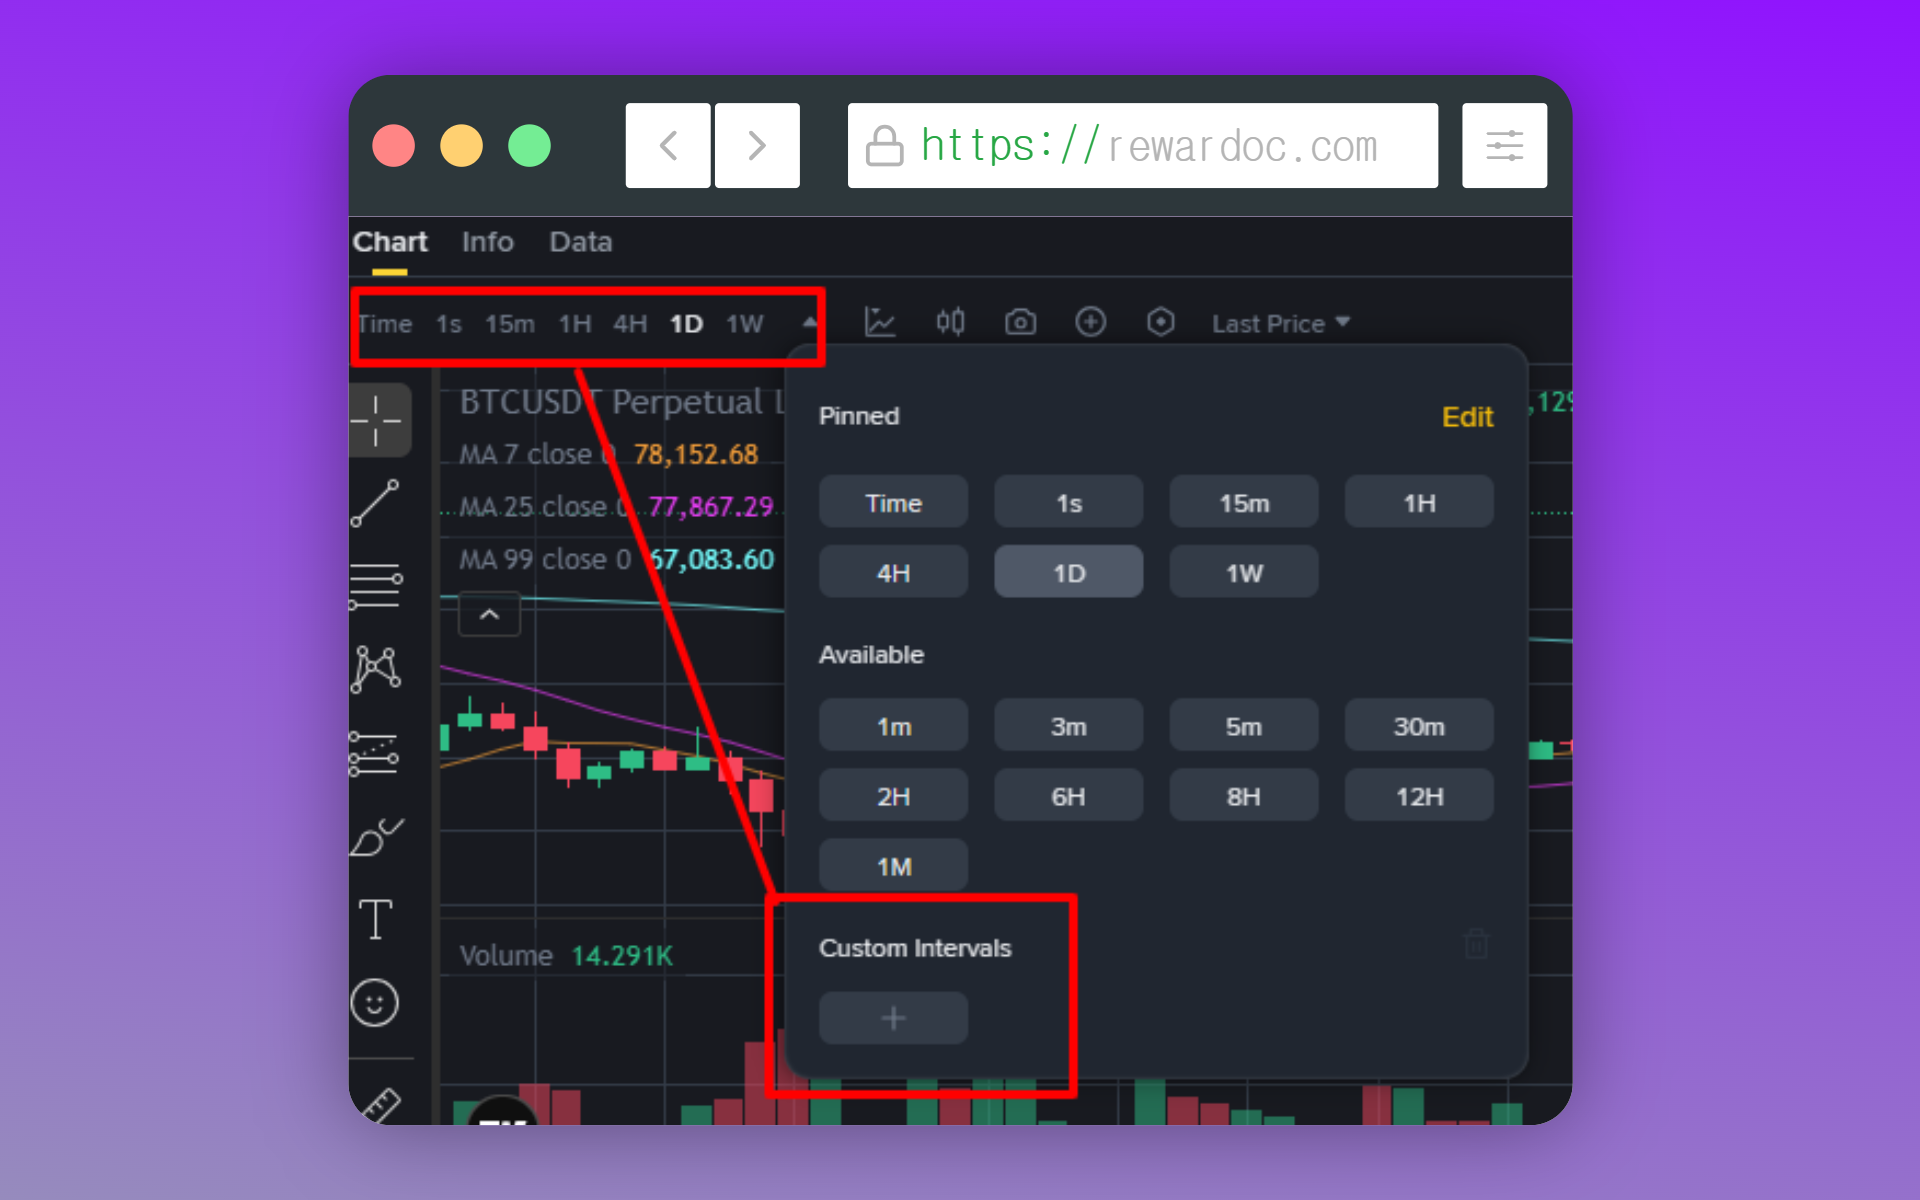
Set your candle interval at the top of the chart. 1m, 15m, 1h, 4h, 1d and so on. Need something that isn't on the list? Type it in yourself under [Custom Intervals].
2. Read the moving averages
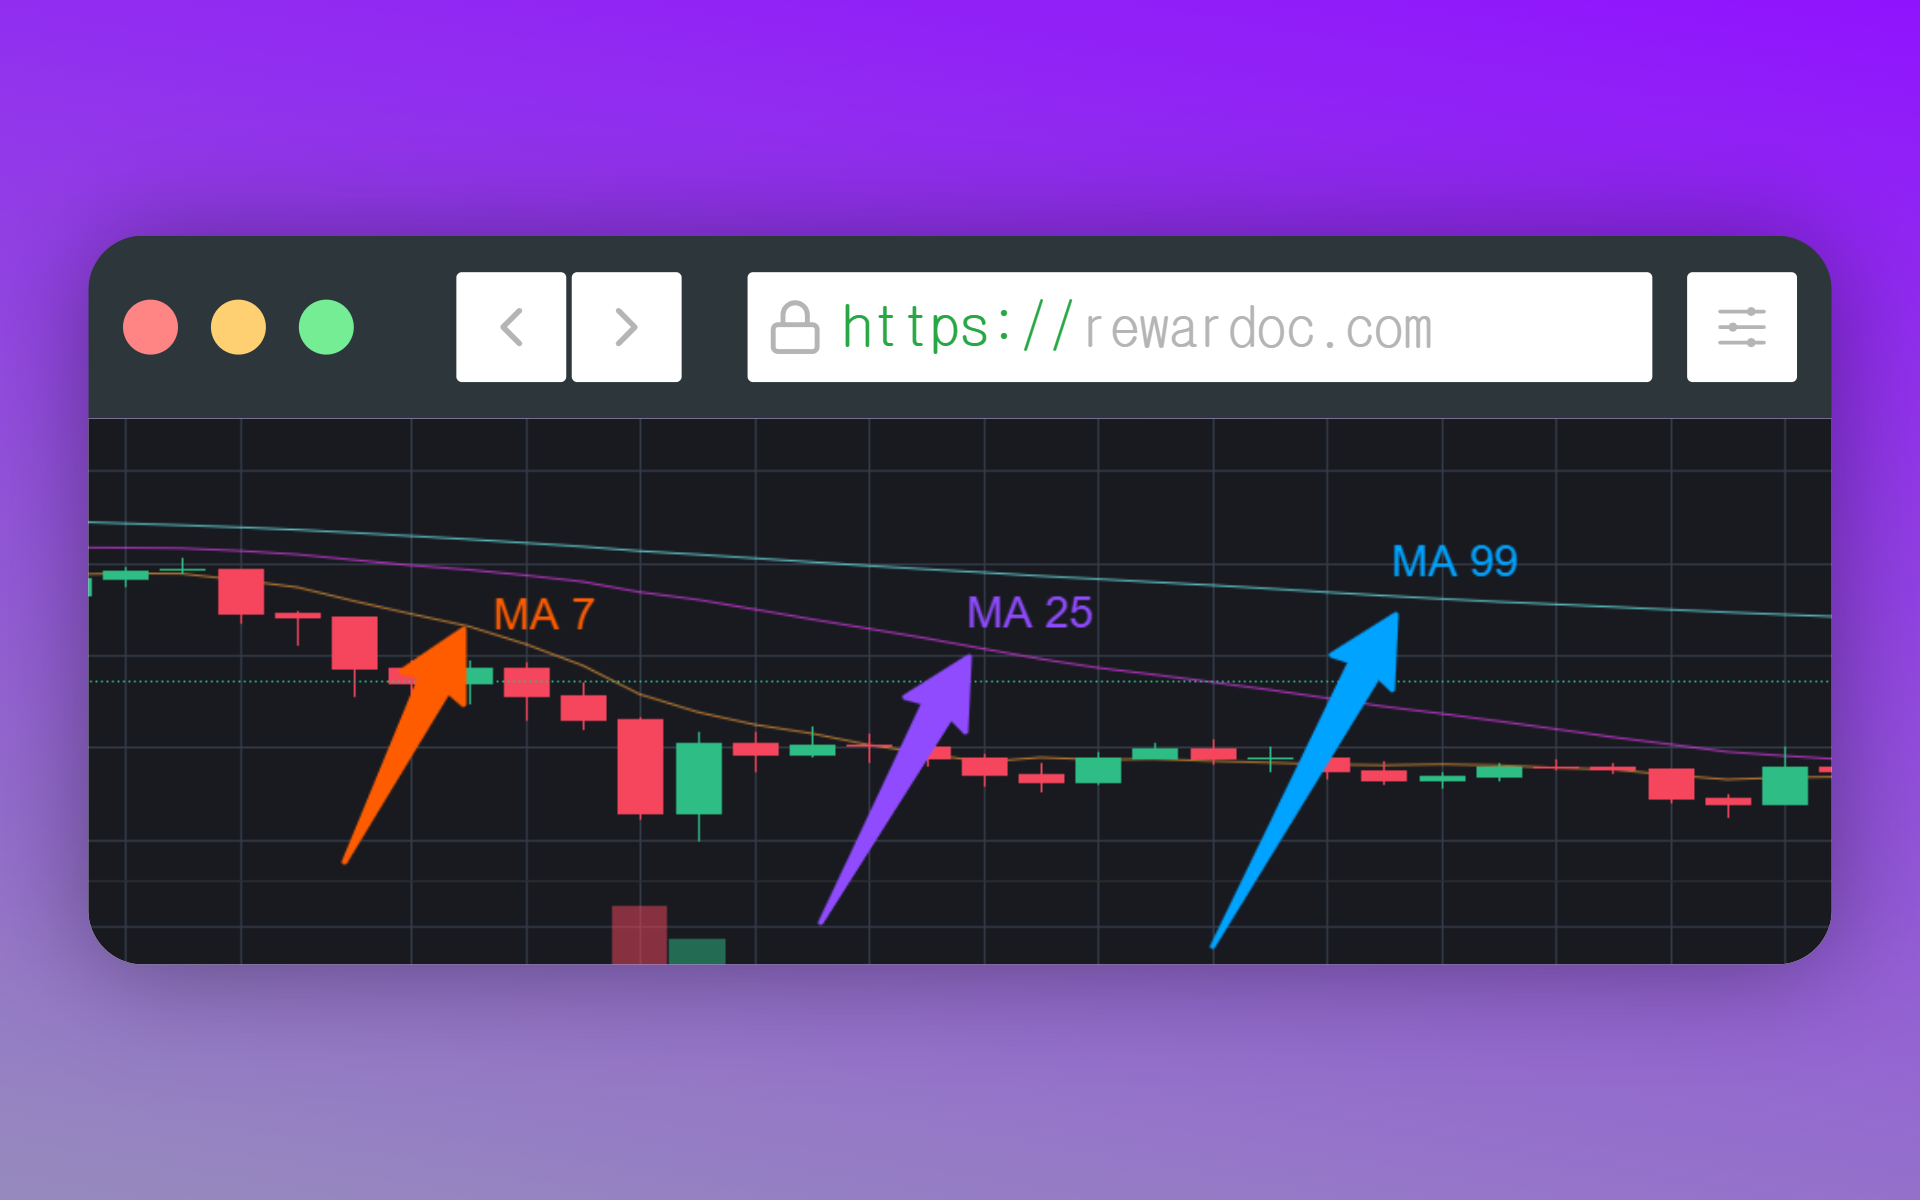
Binance charts ship with three moving averages already on. MA 7 is orange, MA 25 is purple, MA 99 is light blue. The number is a candle count, so on the 1h chart MA 7 is a 7-hour average.
A moving average (MA) is just a line connecting the average price over a set number of periods.
- MA 7 (short-term MA): a line through the average close of the last 7 candles. (7 days on the daily chart)
- MA 25 (mid-term MA): a line through the average close of the last 25 candles. (roughly a month on the daily chart)
- MA 99 (long-term MA): a line through the average close of the last 99 candles. (three-plus months on the daily chart)
3. Adding and removing indicators
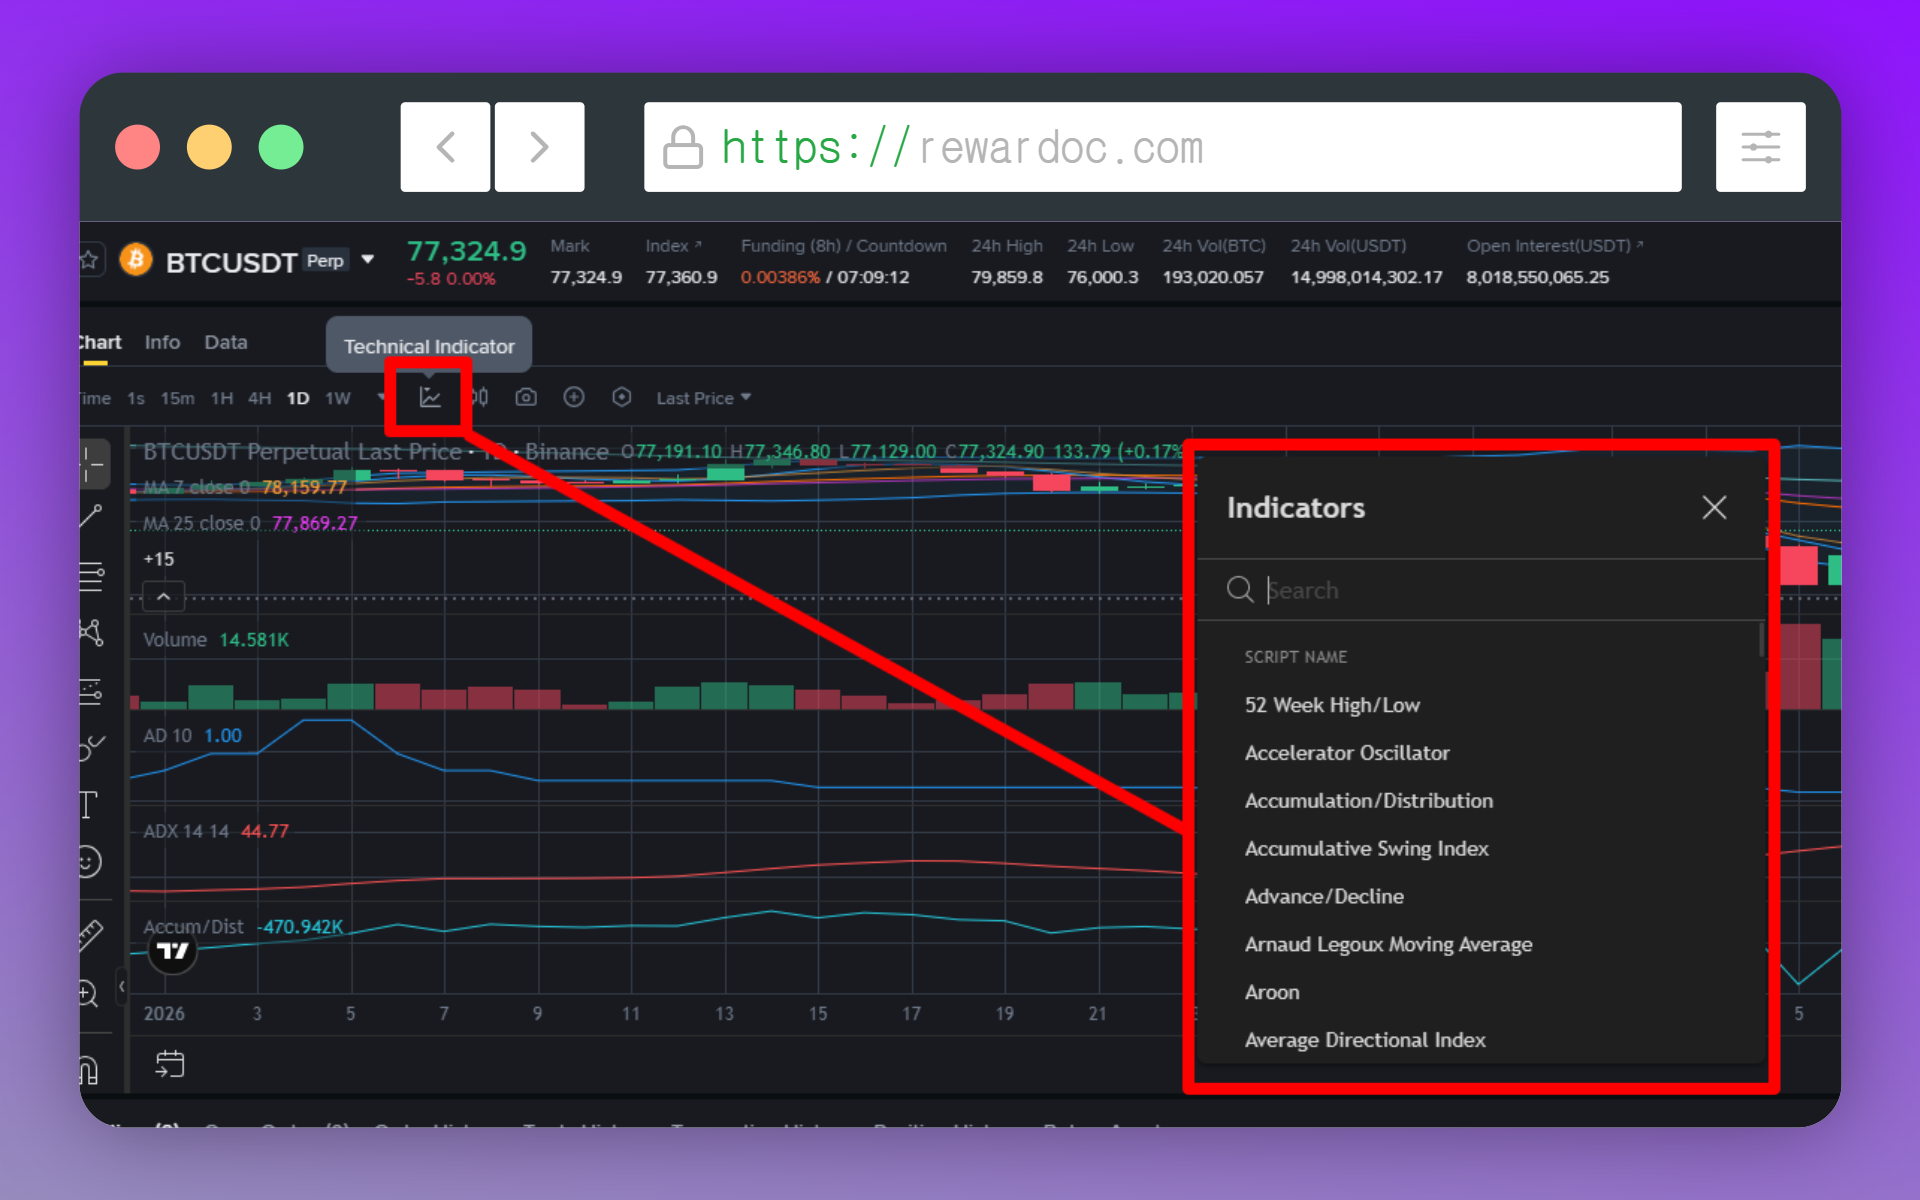
Next to the timeframe menu at the top of the chart, there's a row for adding chart options. Start with [Technical indicator] — search for the indicator you want and drop it on.
The ones most traders actually lean on, and the friendliest place to start, are moving averages (MA), RSI, volume, Bollinger Bands, and MACD. To remove one, click it on the chart and hit the trash icon in the small toolbox that pops up.
4. Set your time zone
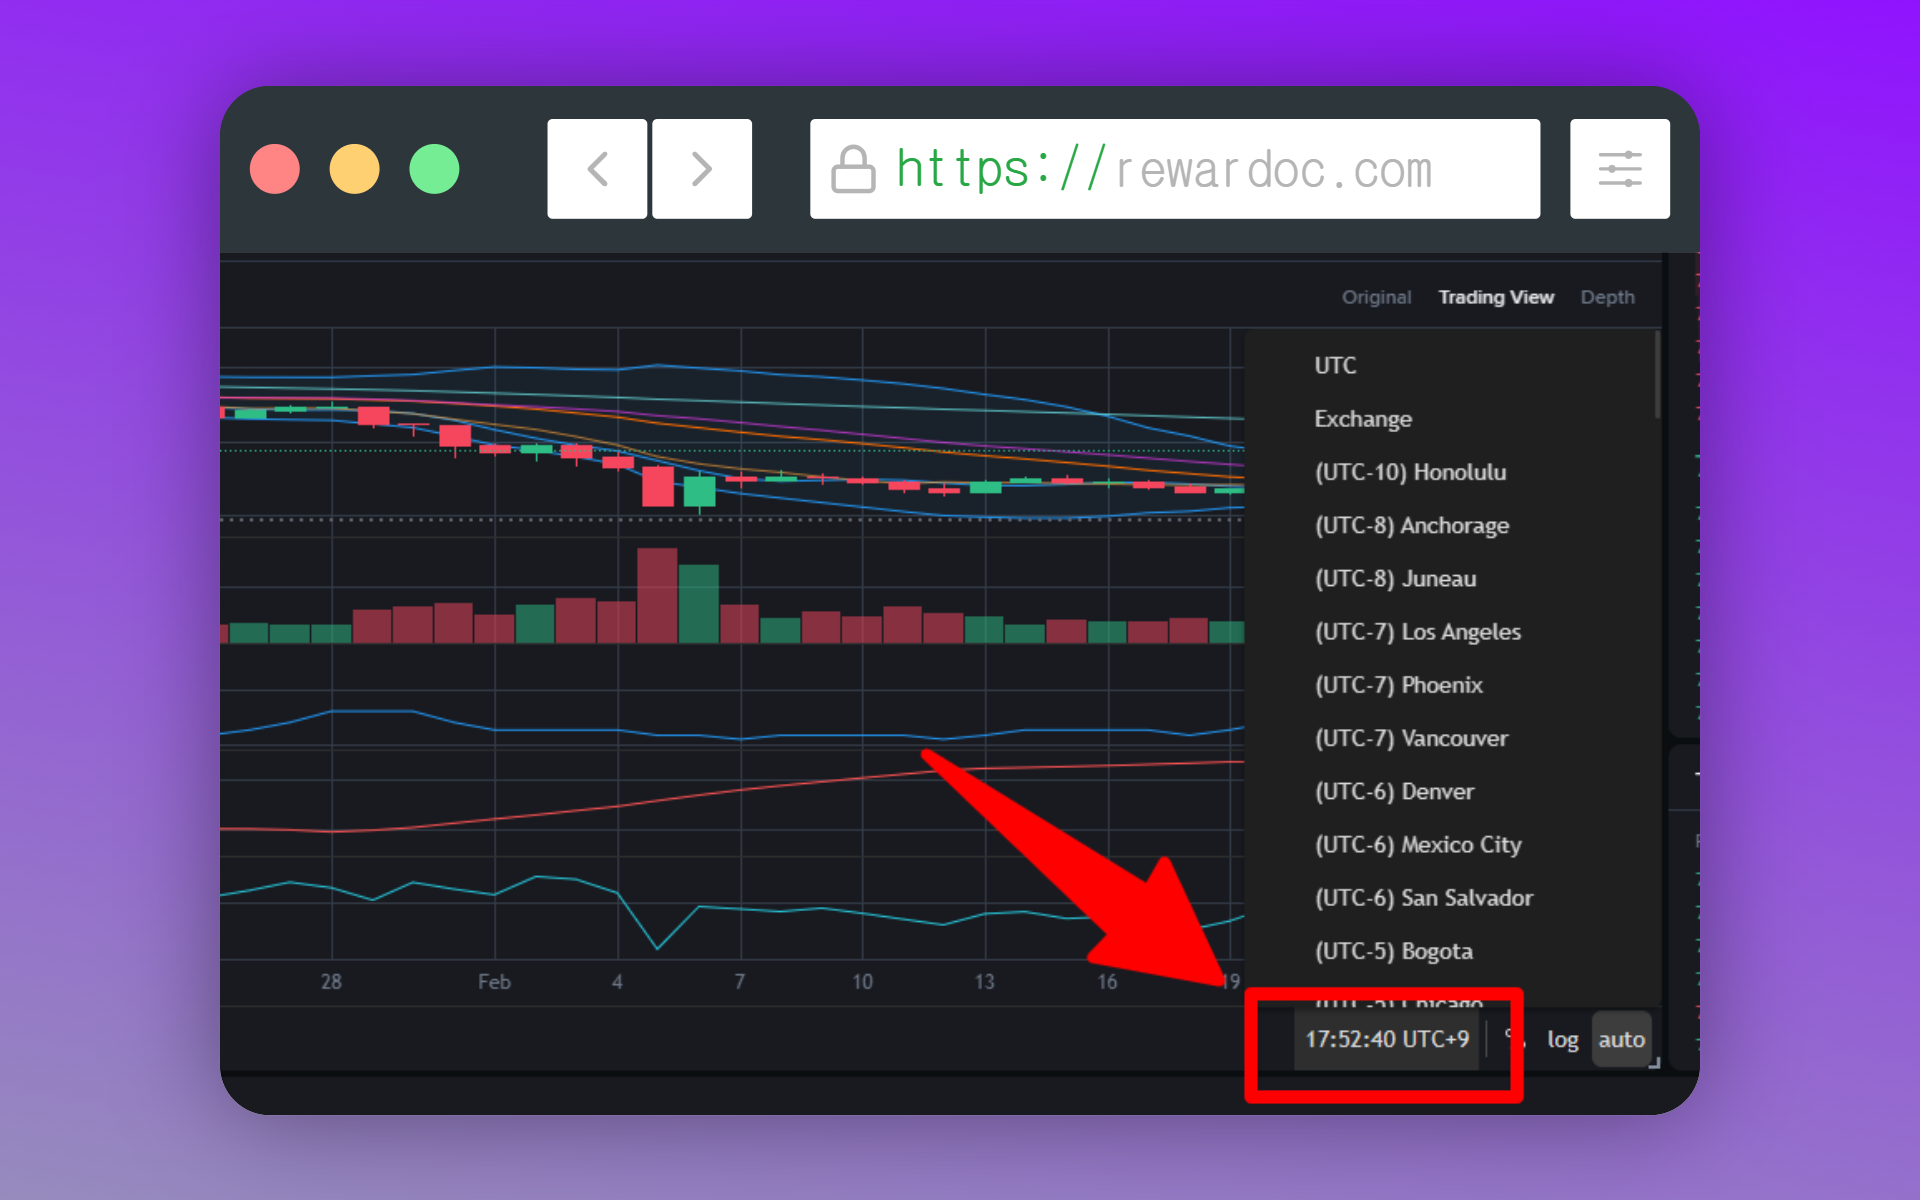
Click the clock at the bottom of the chart to change the time zone. Binance runs its stats on UTC+0. Set the display to your local time and it gets much easier to feel when candles open and close. (Only the display changes — the underlying calculation still runs on UTC.)
When chart settings won't cooperate
- No drawing tools anywhere: you're in Original mode. Switch over to [TradingView].
- Boxes ticked, but nothing on the chart: you may have no fills on that pair, or they're older than 6 months, or they fall outside the most recent 500 orders.
- Your lines are gone when you come back: drawings don't save unless you're logged in.